How you ever used infographics in your classroom? Kathy Schrock has great resources for using infographics in the classroom. I love her definition. "Infographics are a visual representation of data. When students create infographics, they are using information, visual, and technology literacies."
Teachers are always struggling to get their students' attention. It's suggested by neuroscientists that teachers try using stories, images, pictures and visual tools to get their conscious attention. This is where infographics comes in. A very simple example of an infographic is a flowchart. The visuals are the different shapes which represent topics. Then text can be added to the flowchart.
The July issue of Time magazine is full of infographics representing data. There's an infographic on What's the Most Effective Workout?, Where's the Best Beach in America?, Where are the Single Ladies? There can be an infographic for everything with data.
To use infographics effectively in the classroom, I suggest the following,
1. Present your students with different types of infographics. Show them on your Whiteboard for whole group discussion or hand some out to small groups so they can analyze the data presented. Ask your students about the benefits of using infographics instead of just text. What information is gained from the specific infographic? How do the fonts, color and design contribute in gaining information from infographics.
Infographics are great for learning as we process images
60.000x faster than words. (Piktochart)
2. Infographics can be used to make comparisons, show trends, timelines and important or interesting data. Make sure students understand what data is effective in their infographic. Even though students have done their research on a subject, not all the information is relevant for an infographic.
4. Before using the infographic application for the assignment, let your students create a sample. It can be about themselves or a general idea for the whole class. The projects can be completed individually or in groups. Students may like one application over another.
Infographic Resources
- Piktochart - Piktochart has lots of templates, symbols, images and shapes available to create an infographic. It even has a teacher guide.
- Easel.ly - is another free resource with lots of templates available.
- Infogr.am
- InfographicCreator - has a great video tutorial
- Glogster - is now an app that is excellent for younger ages.
- Pic-Collage - is another app that can be used for infographics. I would also recommend it for younger grades.
- Canva - Canva can be used for posters and Pinterest boards. I love Canva's templates.
I love this animated infographic about the evolution of shoes. This is created by Discovery Channel. (It's in Spanish but it's easy to follow.)
Infographics allow students to share information in a creative way.
3. Infographics can be a great alternative for presenting information. Instead of using PowerPoint or Prezi, try using infographics. Make sure to have a rubric or tool for assessment so students know exactly what your expectations are. Try creating your own infographic before you have your students create one.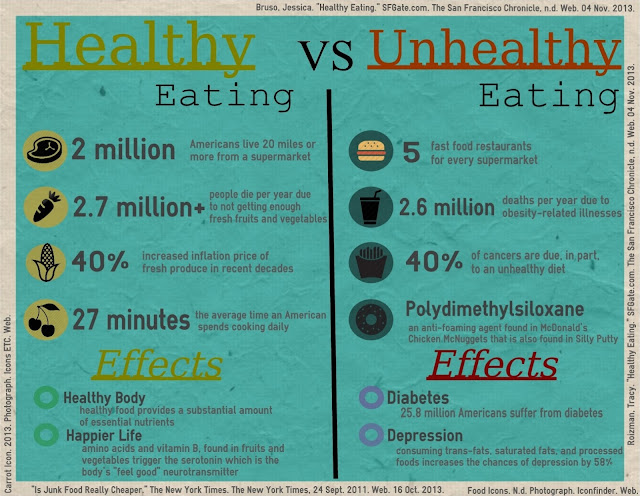 |
| Borrowed from Kaitlin Tucker Blended Classroom |
4. Before using the infographic application for the assignment, let your students create a sample. It can be about themselves or a general idea for the whole class. The projects can be completed individually or in groups. Students may like one application over another.
Infographic Resources
- Piktochart - Piktochart has lots of templates, symbols, images and shapes available to create an infographic. It even has a teacher guide.
- Easel.ly - is another free resource with lots of templates available.
- Infogr.am
- InfographicCreator - has a great video tutorial
- Glogster - is now an app that is excellent for younger ages.
- Pic-Collage - is another app that can be used for infographics. I would also recommend it for younger grades.
- Canva - Canva can be used for posters and Pinterest boards. I love Canva's templates.
I love this animated infographic about the evolution of shoes. This is created by Discovery Channel. (It's in Spanish but it's easy to follow.)










No comments